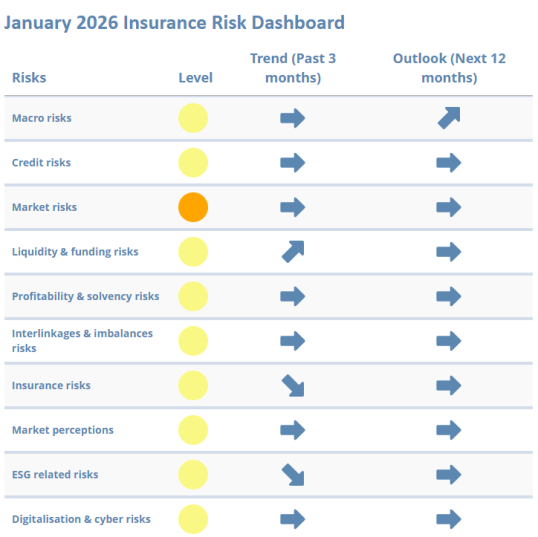
The Risk Dashboard, based on Solvency II data, summarises the main risks and vulnerabilities in the European Union’s insurance sector through a set of risk indicators.
The data is based on financial stability and prudential reporting collected from insurance groups and solo insurance undertakings.
Insurance Risk Dashboard January 2026 (Q3-2025 Solvency II Data)

Key observations:
The January 2026 Insurance Risk Dashboard shows that risks in the European insurance sector are stable at a medium level.
Macroeconomic risks remain stable at medium level, with positive signals from GDP growth and easing inflation. Persistent geopolitical instability, with tensions emerging in Venezuela, Iran and Greenland are further heightening uncertainty and volatility. Together, these developments suggest an upward revision of the macro-risk outlook.
Credit risks: Overall credit conditions remain broadly stable, with only minor shifts in market indicators and portfolio exposures, albeit foreseen increase in public spending in defense and infrastructure. Fundamental credit risks in the corporate sector and household balance sheets are largely unchanged, reflecting continued structural fragilities but no significant signs of deterioration.
Market risks remain elevated with stable outlook. Financial market volatility slightly increased and valuation indicators suggest detachment from fundamentals and annual indicators remain at levels that still requires attention. Insurers’ portfolio allocations and property exposures show little variation, and asset concentration remains stable. Overall, market conditions appear steady but continue to reflect heightened vulnerabilities. Risk related to the potential AI bubble might boost volatility without necessarily default concerns significantly increasing.
Liquidity and funding conditions remain at medium risk level with increasing trend. Insurers’ cash positions and liquid asset ratios show only minor changes, while bond issuance increased and activity in the catastrophe bond market has picked up slightly. Other key indicators are largely unchanged.
Profitability and solvency conditions remain stable at a medium level. Insurers’ capital positions have strengthened slightly, supported by robust solvency ratios. Profitability indicators show little overall change, with underwriting and investment performance broadly stable. Overall, the sector continues to demonstrate resilience, though without significant improvement in underlying trends.
Go to the January 2026 Insurance Risk Dashboard
Note:
- The reference date for company data is Q2-2025 for quarterly indicators and 2024-YE for annual indicators. The cut-off date for most market indicators is the end of September 2025.
- The Level (color) corresponds to the level of risk as of the reference date, the Trend is displayed for the 3 months preceding the reference date and the Outlook is displayed for the 12 months after the reference date. The latter is based on the responses received from 23 national competent authorities (NCAs) and ranked according to the expected change in the materiality of each risk (substantial decrease, decrease, unchanged, increase and substantial increase).
Previous Dashboards
EIOPA's previous Insurance Risk Dashboards are available here.