
Quarterly risk assessment of the EU insurance industry
The Risk Dashboard, based on Solvency II data, summarises the main risks and vulnerabilities in the European Union’s insurance sector through a set of risk indicators.
The data is based on financial stability and prudential reporting collected from insurance groups and solo insurance undertakings.

Insurance Risk Dashboard July 2026 (Q1-2026 Solvency II Data)
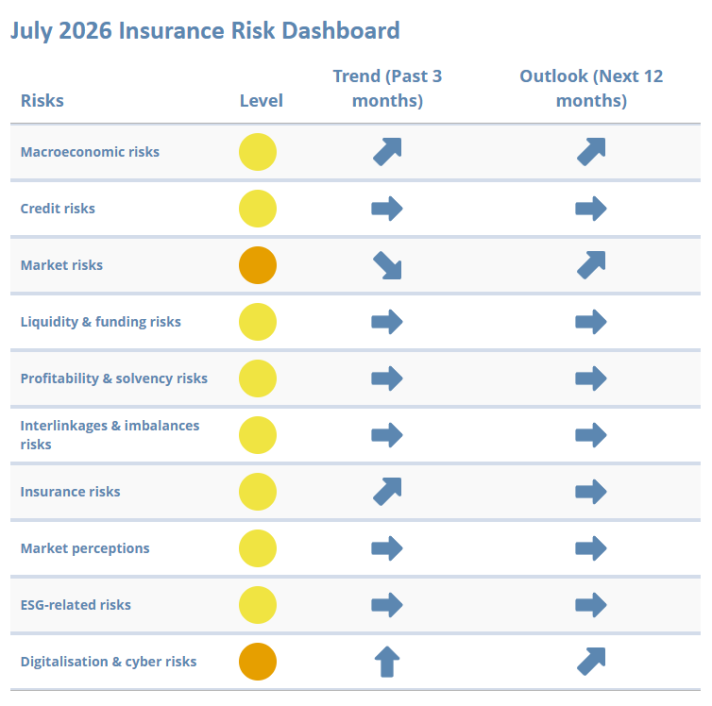
Key observations:
The July 2026 Insurance Risk Dashboard shows that risks in the European insurance sector are stable at a medium level.
- Macroeconomic risks are assessed at a medium level, although with a worsening outlook as recent geopolitical tensions pile downside risks on already weakened growth and higher inflation expectations.
- Insurers’ portfolio of high-quality assets and broadly unchanged fundamentals keep credit risks steady, although financing costs and private credit vulnerabilities warrant monitoring.
- Market risks moderated through end-June, but renewed geopolitical tensions and commodity market volatility have darkened the outlook, while concerns about elevated valuations and the potential for a broader market correction persist.
- Liquidity and funding conditions are broadly unchanged, supported by stable cash and liquid asset positions.
- Broadly unchanged capital positions and mixed profitability indicators underpin a stable medium assessment for solvency and profitability risks.
- Strong premium growth supports a medium assessment for insurance risks, despite some deterioration in loss ratios and uncertainty around war- and trade-related coverages.
- ESG-related risks are largely stable, with a modest increase in green bond holdings and little change in climate-related exposures.
- Digitalisation and cyber risks have increased to a high level, reflecting frontier AI developments, geopolitical tensions and elevated cyber underwriting exposures.
Go to the July 2026 Insurance Risk Dashboard
Note:
- The reference date for company data is Q1-2026 for quarterly indicators and 2025-YE for annual indicators. The cut-off date for most market indicators is the end of June 2026.
- The Level (color) corresponds to the level of risk as of the reference date, the Trend is displayed for the 3 months preceding the reference date and the Outlook is displayed for the 12 months after the reference date. The latter is based on the responses received from 23 national competent authorities (NCAs) and ranked according to the expected change in the materiality of each risk (substantial decrease, decrease, unchanged, increase and substantial increase).
Previous Dashboards
EIOPA's previous Insurance Risk Dashboards are available here.