
Quarterly risk assessment of the EU insurance industry
The Risk Dashboard, based on Solvency II data, summarises the main risks and vulnerabilities in the European Union’s insurance sector through a set of risk indicators.
The data is based on financial stability and prudential reporting collected from insurance groups and solo insurance undertakings.

Insurance Risk Dashboard October 2026 (Q2-2026 Solvency II Data)
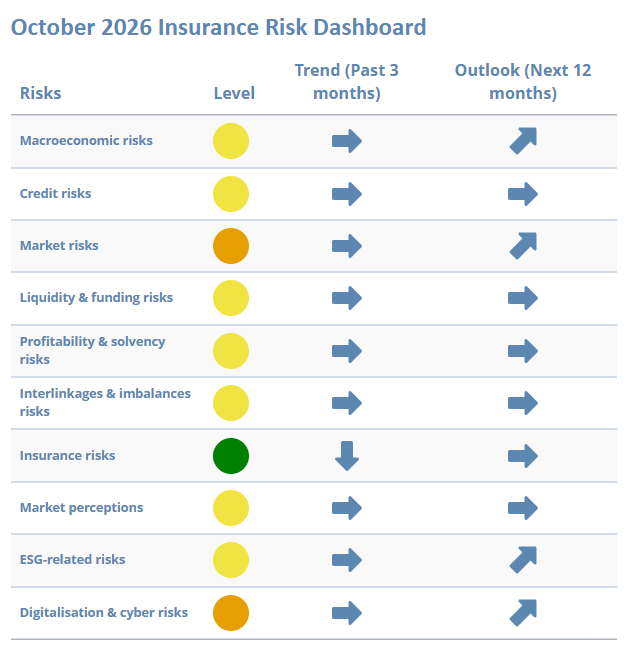
Key observations:
The October 2026 Insurance Risk Dashboard shows that market and cyber risks remain elevated amid a geopolitically complex environment.
- Macroeconomic risks remain at a medium level, with a deteriorating outlook against a backdrop of persistent geopolitical instability and elevated uncertainty. While the economy continues to show resilience, rising interest rates could put further pressure on the sustainability of sovereign debt.
- Credit risks remain stable amid moderately wider spreads supported by insurers’ high-quality asset portfolios and broadly unchanged fundamentals, even as debt financing costs and private credit quality require continued monitoring.
- The increase in bond market volatility towards the end of September 2026 keeps market risks elevated. Looking ahead, the risk outlook remains influenced by the potential for a broader market correction and uncertainty over whether renewed geopolitical tensions could lead to a repricing of risk premia.
- Broadly unchanged capital positions and mixed profitability indicators support a stable medium assessment for solvency and profitability risks.
- Strong premium growth across life and non-life business, alongside an improved upper tail of the loss ratio distribution, means that insurance risks have declined to a low level.
- ESG-related risks are largely stable, with a modest increase in green bond holdings. That said, supervisors expect the outlook for this risk category to deteriorate over the next 12 months.
- Digitalisation and cyber risks are elevated, with a worsening outlook, reflecting concerns over frontier AI models, digital spillovers from geopolitical conflicts, and insurers’ exposure through cyber underwriting.
Go to the October 2026 Insurance Risk Dashboard
Note:
- The reference date for company data is Q2-2026 for quarterly indicators and 2025-YE for annual indicators. The cut-off date for most market indicators is the end of September 2026.
- The Level (color) corresponds to the level of risk as of the reference date, the Trend is displayed for the 3 months preceding the reference date and the Outlook is displayed for the 12 months after the reference date. The latter is based on the responses received from 23 national competent authorities (NCAs) and ranked according to the expected change in the materiality of each risk (substantial decrease, decrease, unchanged, increase and substantial increase).
Previous Dashboards
- July 2026 Insurance Risk Dashboard
- April 2026 Insurance Risk Dashboard
- January 2026 Insurance Risk Dashboard
- October 2025 Insurance Risk Dashboard
- July 2025 Insurance Risk Dashboard
- April 2025 Insurance Risk Dashboard
- January 2025 Insurance Risk Dashboard
- October 2024 Insurance Risk Dashboard
- July 2024 Insurance Risk Dashboard
- May 2024 Insurance Risk Dashboard
- February 2024 Insurance Risk Dashboard
- November 2023 Insurance Risk Dashboard - updated
- July 2023 Insurance Risk Dashboard
- May 2023 Insurance Risk Dashboard
- January 2023 Insurance Risk Dashboard
- October 2022 Insurance Risk Dashboard
- July 2022 Insurance Risk Dashboard
- April 2022 Insurance Risk Dashboard
- January 2022 Insurance Risk Dashboard
- October 2021 Insurance Risk Dashboard
- July 2021 Insurance Risk Dashboard
- April 2021 Insurance Risk Dashboard
- January 2021 Insurance Risk Dashboard