Insurance Risk Dashboard April 2026 (Q4-2025 Solvency II Data)
Key observations:
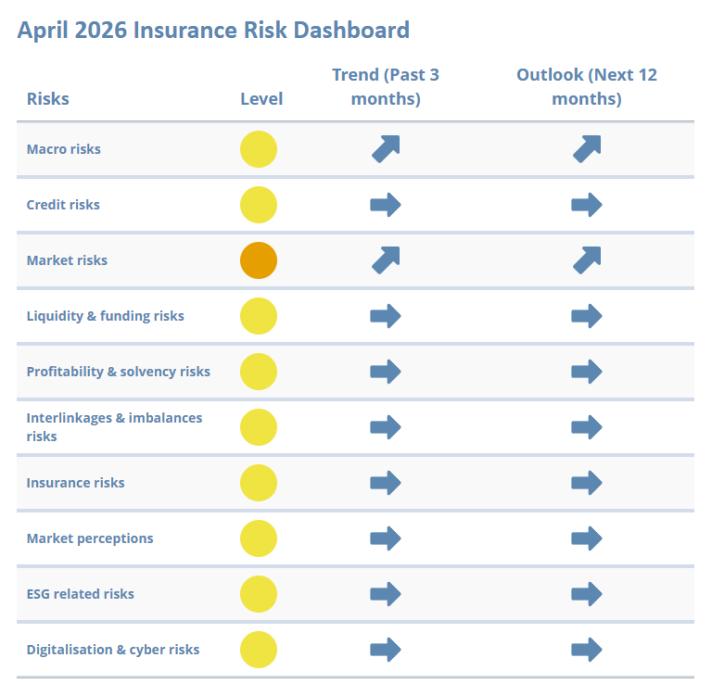
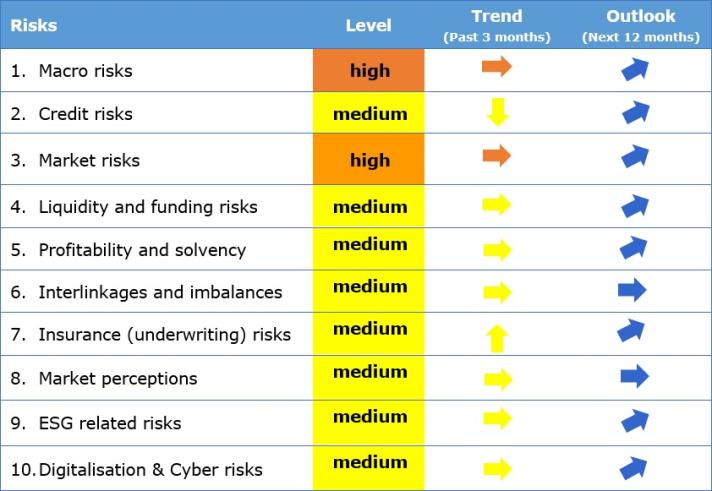
The April 2026 Insurance Risk Dashboard shows that risks in the European insurance sector are stable at a medium level.
Somewhat higher inflation expectations, combined with persistent geopolitical tensions, continue to shape the macroeconomic environment. Uncertainty surrounding the conflict in Iran and its potential implications for energy prices may further amplify downside risks.
Credit risks remain steady, with broadly unchanged fundamentals and high portfolio quality, despite some reallocation toward riskier bond segments and wider spreads.
Increasing volatility in both bond and equity markets is driving a more elevated market risk outlook.
Liquidity and funding conditions remain broadly unchanged, supported by stable cash and liquid asset and supportive lapse developments.
Solvency and profitability risks are stable at a medium level, with modestly stronger capital positions and mixed profitability indicators.
Strong premium growth and stable underwriting performance support a medium level of insurance risks, although uncertainty around marine, aviation and trade-related claims persists.
Digitalisation and cyber exposures continue to shape the risk landscape. In the current geopolitical context, cyber threats remain a significant concern, adding complexity both to insurers’ operations and to the underwriting of cyber risks.
Go to the April 2026 Insurance Risk Dashboard
Insurance Risk Dashboard January 2026 (Q3-2025 Solvency II Data)
Key observations:
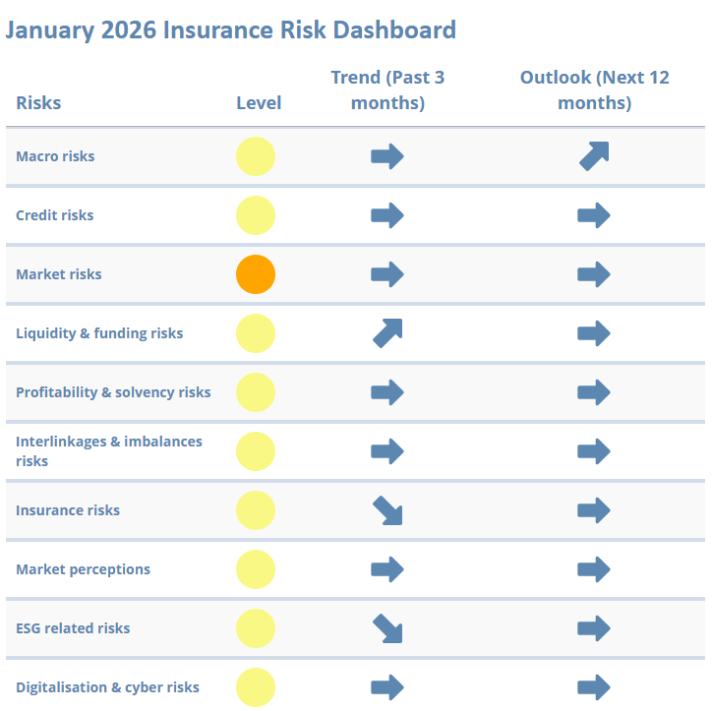
The January 2026 Insurance Risk Dashboard shows that risks in the European insurance sector are stable at a medium level.
Macroeconomic risks remain stable at medium level, with positive signals from GDP growth and easing inflation. Persistent geopolitical instability, with tensions emerging in Venezuela, Iran and Greenland are further heightening uncertainty and volatility. Together, these developments suggest an upward revision of the macro-risk outlook.
Credit risks: Overall credit conditions remain broadly stable, with only minor shifts in market indicators and portfolio exposures, albeit foreseen increase in public spending in defense and infrastructure. Fundamental credit risks in the corporate sector and household balance sheets are largely unchanged, reflecting continued structural fragilities but no significant signs of deterioration.
Market risks remain elevated with stable outlook. Financial market volatility slightly increased and valuation indicators suggest detachment from fundamentals and annual indicators remain at levels that still requires attention. Insurers’ portfolio allocations and property exposures show little variation, and asset concentration remains stable. Overall, market conditions appear steady but continue to reflect heightened vulnerabilities. Risk related to the potential AI bubble might boost volatility without necessarily default concerns significantly increasing.
Liquidity and funding conditions remain at medium risk level with increasing trend. Insurers’ cash positions and liquid asset ratios show only minor changes, while bond issuance increased and activity in the catastrophe bond market has picked up slightly. Other key indicators are largely unchanged.
Profitability and solvency conditions remain stable at a medium level. Insurers’ capital positions have strengthened slightly, supported by robust solvency ratios. Profitability indicators show little overall change, with underwriting and investment performance broadly stable. Overall, the sector continues to demonstrate resilience, though without significant improvement in underlying trends.
Go to the January 2026 Insurance Risk Dashboard
Insurance Risk Dashboard October 2025 (Q2-2025 Solvency II Data)
Key observations:
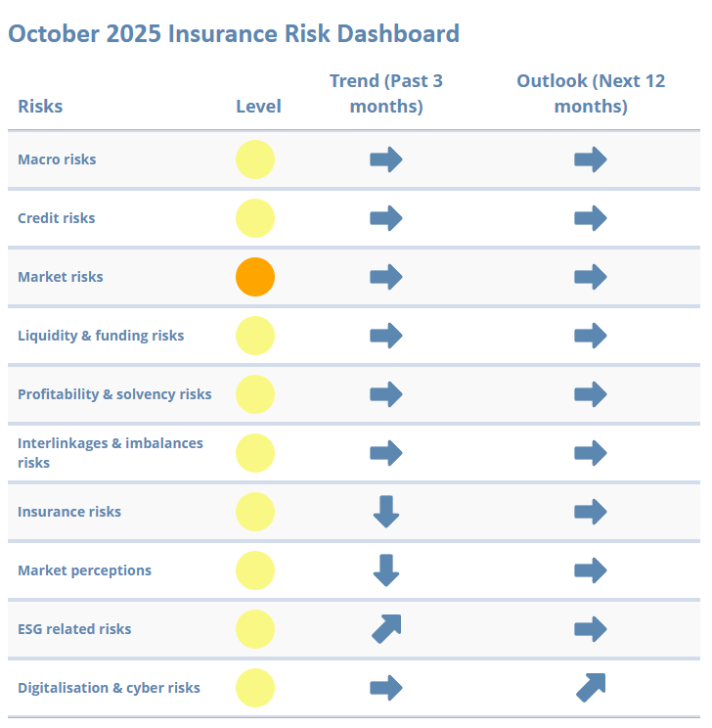
The October 2025 Insurance Risk Dashboard shows that risks in the European insurance sector are stable at a medium level.
Macroeconomic risks remain steady at a medium level as growth and inflation forecasts as well as monetary policy expectations show little movement. Fiscal and credit indicators stay weak, while labour markets have also softened slightly.
Credit risks are unchanged, with a solid portfolio quality and limited market impact from recent fiscal and political developments.
Market risks stay elevated but stable. Volatility has eased somewhat, yet valuations remain stretched, warranting continued attention. Other annual indicators also contribute to maintaining the elevated overall risk profile.
Liquidity and funding conditions are steady, supported by stable cash positions and only minor changes in key indicators.
Profitability and solvency remain firm, with a slight improvement in insurers’ capital positions and strong levels of high-quality own funds.
Insurance risks show a downward trend, as life premium growth moderates and underwriting results stabilise.
ESG risks remain at a medium level, although with an increasing trend. Insurers’ investments in green bonds as a share of the overall green bond universe decreased slightly, while undertakings’ median exposure to climate-relevant assets grew.
Cyber and digitalisation risks are gaining prominence, with an increased perceived likelihood of incidents and growing concerns around the vulnerabilities of IT systems.
Go to the October 2025 Insurance Risk Dashboard
Insurance Risk Dashboard July 2025 (Q1-2025 Solvency II Data)
Key observations:
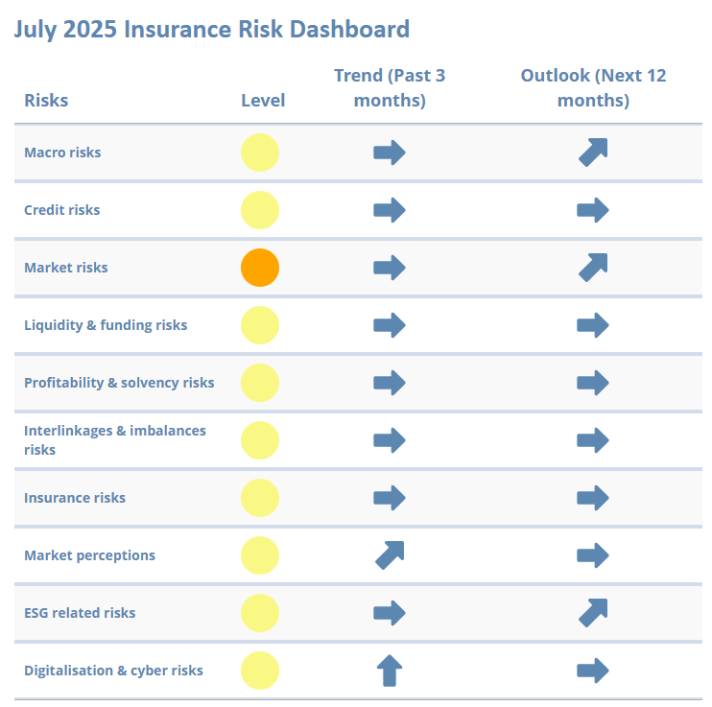
The July 2025 Insurance Risk Dashboard is based on Q1 2025 Solvency II data and Q2 2025 market data. The main findings show that risks in the European insurance sector are stable at a medium level. However, some areas have a negative outlook for the next 12 months, marked by geopolitical tensions, uncertain trade dynamics, and market volatility.
The macroeconomic risks remain at medium level, even though lower inflation forecasts have coincided with modest downward revisions in global GDP. A temporary pause in tariff escalation and ongoing trade negotiations have offered partial relief, but uncertainty persists. Declines in long-term interest rates and monetary policy rates, coupled with slight fiscal deterioration across major economies, have done little to improve the overall risk sentiment. The recent conflict escalation in the Middle East and unclear trade outcomes continue to weigh on the outlook.
Credit risks remain stable, with minimal movements in risk premia and largely unchanged insurer investment allocations. Credit quality remains high, and household debt registered a slight drop in the euro area.
Market risks, however, continue to be a cause for concern, particularly due to persistent volatility in fixed income markets and a potential disconnect between equity valuations and underlying fundamentals. Insurers’ asset exposures have remained broadly stable, while commercial real estate values continue to lag behind the recovery seen in residential properties.
Liquidity and funding risks are also stable, but reflect mixed signals. While cash flow sustainability has improved, a deterioration in liquid asset ratios and persistently high lapse rates remain potential vulnerabilities.
Solvency and profitability indicators held up in early 2025, with strong capitalisation across the sector. While returns on assets and premiums improved, other profitability metrics saw slight declines. Non-life underwriting results strengthened, while life investment returns were stable.
Financial interlinkages risks remain largely unchanged. Insurers’ exposures to banks, sovereign debt, and financial markets are steady, though the share of premiums ceded to reinsurers has slightly increased.
Insurance-specific risks are stable at medium level, supported by robust year-on-year premium growth in life and non-life business lines and an improved loss ratio in Q1 2025.
Market sentiment remains cautiously optimistic withthe sector being perceived as relatively safe during recent market turbulence. While life insurance stocks underperformed, non-life insurers posted stronger results. Credit Default Swap spreads narrowed, though elevated valuations and geopolitical risks could still trigger repricing in the near term.
ESG risks are stable, though trending upward. Exposure to green bonds increased, while their holdings of broader climate-relevant assets slightly declined. Physical climate risks, particularly windstorms, remained constant.
Cyber and digitalisation risks are gaining prominence, with an increased perceived likelihood of incidents and growing concerns around IT system vulnerabilities.
The insurance sector has shown notable overall resilience, but close monitoring and continued vigilance are necessary as geopolitical, market and operational risks continue to evolve.
Go to the July 2025 Insurance Risk Dashboard
Insurance Risk Dashboard April 2025 (Q4-2024 Solvency II Data)

The April 2025 Insurance Risk Dashboard is based on Q4 2024 Solvency II data and Q1 2025 market data. The main findings show that risks in the European insurance sector are stable and overall at medium levels, with pockets of vulnerabilities stemming from ongoing market volatility related to high geopolitical uncertainty.
Global macroeconomic risks remain stable at a medium level, with a slight decrease in GDP growth and an increase in inflation forecasts. Looking ahead, geopolitical uncertainty and fragmentation may negatively impact the macroeconomic landscape.
Credit risks remained stable through March 2025, with minimal movement in spreads and only slight shifts in investment allocations. Portfolio quality stayed high despite a small rise in lower-rated assets. Early April saw a modest widening of spreads as financial market participants reassessed risk premiums.
Market risks remain elevated amid high volatility in bonds and equities, with a worsening risk outlook. Insurers slightly increased their bond exposures, while equity holdings held steady. Real estate values fell, but insurers’ exposures stayed limited. In April, the announcement of US tariffs triggered sharp market reactions. While markets have stabilised somewhat, further asset price corrections are likely in view of high policy uncertainty.
Liquidity risks stayed at a medium level. Cash holdings continued to be stable and cash flow positions stayed positive. Insurers’ liquid asset ratios slightly increased even as lapse rates remained elevated at the end of Q4 2024. On the derivative side, while the insurance sector has been resilient in addressing liquidity needs so far, effective liquidity management remains crucial to navigate potential new market shocks in the current environment.
Solvency and profitability risks held steady. Solvency ratios were robust in the last quarter of 2024, with slight shifts across different segments. Profitability showed mixed signals, with some return metrics improving while others fell. The non-life combined ratio was unchanged.
Risks stemming from financial interlinkages remained stable. Exposures to banks, reinsurers, and derivatives showed little change, and reinsurance cessions stayed consistent.
Insurance risks were also stable, with both life and non-life premium growth rising while loss ratios showed a slight decline.
Market sentiment remained at a medium risk level. Life insurers outperformed the market in March, though European insurance stocks were impacted negatively in April, mirroring broader market trends.
ESG risks were steady but with an intensifying outlook. Green bond exposures increased, while climate-sensitive assets dipped. In the current geopolitical context, shifting environmental agreements are creating additional challenges to achieving long-term sustainability objectives.
Cyber and digital risks stayed at a medium level, albeit with a rising outlook. Threat perceptions have increased, with geopolitical tensions remaining a key factor.
Go to the April 2025 Insurance Risk Dashboard
Insurance Risk Dashboard January 2025 (Q3-2024 Solvency II Data)

The January 2025 Insurance Risk Dashboard shows that risks in the European insurance sector are stable and overall at medium levels, with pockets of vulnerabilities stemming from market volatility and shifts in real estate prices.
Macroeconomic risks remain stable at a medium level, with GDP growth and inflation forecasts holding steady. Geopolitical tensions are reshaping global dynamics, heightening concerns about declining international cooperation and escalating risks and uncertainties in the years to come.
Market risks remain at a high level. While bond volatility stabilised, it remains above historical standards.
Liquidity and funding risks are at a medium level but with an upward trend due to a gradual increase of risks across various indicators over the last year and the worsening of funding conditions in Q4 2024.
Solvency and profitability risks are unchanged at a medium level. Solvency ratios for insurance groups and solo undertakings in the non-life segment showed a slight improvement in Q3 2024, while remaining largely unchanged for life undertakings.
Credit risk, insurance risks, market perceptions as well as interlinkages and imbalances risks are all assessed at medium levels.
With regard to ESG related risks, the outlook for the next 12 months is pointing to an increase in risks as growing skepticism and evolving dynamics in environmental agreements make it more challenging to ensure consistent progress towards long-term sustainability goals.
Supervisors have also noted a slight increase in trend regarding digitalisation and cyber risks in Q4 2024, driven by the higher perceived probability of these risk materialising.
Go to the January 2025 Insurance Risk Dashboard
Insurance Risk Dashboard October 2024 (Q2-2024 Solvency II Data)

The October 2024 Insurance Risk Dashboard shows that risks in the European insurance sector are stable and overall, at medium levels, with pockets of vulnerabilities stemming from market volatility and real estate prices.
Market risks remain elevated due to high market volatility and persisting vulnerabilities in the real estate market of the euro area. The latest data on real estate prices shows a continued decline, although at a slower pace than in previous quarters.
All other risk categories remain at a medium level.
With regard to macro risks, forecasted GDP growth has held steady, inflation forecasts have slightly eased and fiscal balances at end-September 2024 even showed an improvement compared to the previous quarter. On credit risks, credit default swaps (CDS) spreads for government and corporate bonds are broadly unchanged, except for the spreads for financial unsecured corporate bonds, which have narrowed.
Within liquidity and funding risks, funding conditions in the catastrophe bond market improved compared to the previous quarter, while other liquidity indicators remained largely unchanged.
Concerning solvency and profitability risks, solvency ratios for insurance groups and life solo undertakings fell slightly in the second quarter of the year while remaining largely unchanged for non-life undertakings. Recent data on return of assets, return to premiums and return on excess assets over liabilities point to a stable profitability outlook for insurers.
Market perceptions of the insurance sector remain stable, yet shows a upward trend as valuation multiples increased for some groups. During this period, life and non-life insurance stocks have outpaced the market.
ESG-related risks and digitalisation and cyber risks show a worsening risk outlook for the next 12 months based on the assessment of national supervisors.
Go to the October 2024 Insurance Risk Dashboard
Insurance Risk Dashboard July 2024 (Q1-2024 Solvency II Data)

Key observations:
The July 2024 Insurance Risk Dashboard shows that risks in the European insurance sector are stable and overall at medium levels, with pockets of vulnerabilities stemming from market volatility and real estate prices.
Macro risks are at a medium level, with forecasted GDP growth for major geographical areas showing positive developments and forecasted inflation slightly declining. Credit risks are also at a medium level, with overall high credit quality of insurers’ investments and credit default swaps (CDS) spreads for financial unsecured and non-financial corporate bonds slightly increasing.
Market risks remain at a high level due to market volatility and persisting real estate market vulnerabilities in the Euro Area. Latest available annual data shows that the spread of investment returns over guaranteed interest rates for life insurance undertakings turned positive in 2023, driven by positive market returns.
Liquidity and funding risks are at a medium level with overall stable liquidity positions across the insurance sector. Funding conditions in the catastrophe bond market have slightly deteriorated in the first quarter of 2024, with lower volumes issued at a higher spread compared to the previous quarter. Solvency and profitability risks are also unchanged at medium level. Solvency ratios declined slightly in the first quarter of the year, while the latest available data points to an improvement in the non-life combined ratio and in the return on investments for life insurance undertakings.
Market perceptions of the insurance sector remain stable at medium level. Insurers' CDS spreads increased in June, but there was also an improvement in the external rating outlook for some insurance groups.
All remaining risk categories are at medium level, with ESG related risks and Digitalisation and cyber risks showing a worsening risk outlook for the next 12 months based on the assessment of national supervisors.
Go to the July 2024 Insurance Risk Dashboard
Insurance Risk Dashboard May 2024 (Q4-2023 Solvency II Data)
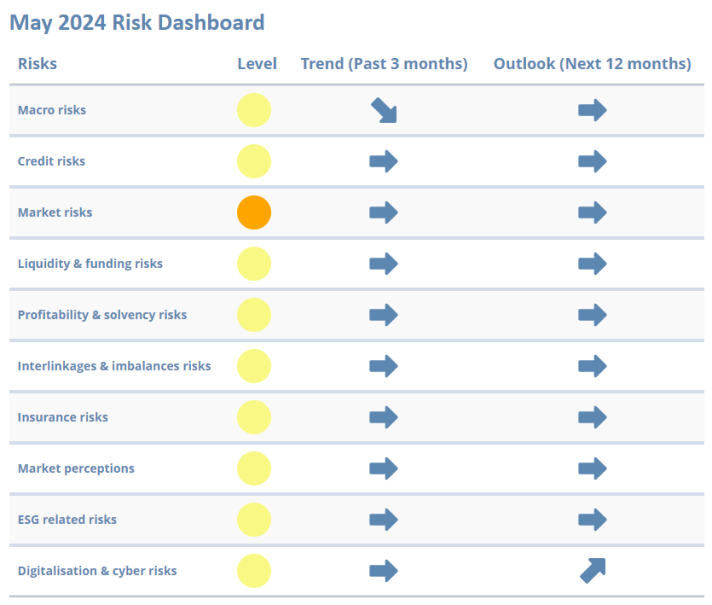
The May 2024 Insurance Risk Dashboard shows that risks in the EU’s insurance sector are stable and overall at medium levels, with pockets of vulnerabilities stemming from market uncertainty and potential risks in the real estate sector.
On macro risks, while some forward-looking indicators have eased and point to positive developments, GDP growth remains relatively low by historical standards. Credit risks are steady following a slight decrease in credit default swaps spreads. Nevertheless, credit risks require close monitoring as insurers maintain a high exposure to sovereign and corporate bonds. Market risks pose challenges driven by market volatility and declining commercial real estate prices in the first half of 2023.
Liquidity and funding risks remain stable at a medium level, yet lapse rates have increased at the end of last year and are being closely monitored. Profitability and solvency risks are also stable at a medium level, with improved returns in end-2023 compared to 2022 and overall stable solvency ratios in Q4-2023 compared to previous quarters of 2023.
Insurers’ interlinkages and imbalances with other parts of the financial system are closely watched. Insurers’ exposure to financial activities other than banking and insurance increased slightly in the last quarter of 2023. Regarding Insurance risks, premium growth has been positive for both life and non-life segments and there was a slight deterioration in the median loss ratio.
ESG-related risks are stable with no signs of relevant changes in the indicators monitoring transition and physical risks.
The materiality of Digitalisation & Cyber risks in the first quarter of 2024 as assessed by insurance supervisors slightly increased, as well as the indicator on cyber negative sentiment.
Go to the May 2024 Insurance Risk Dashboard
Insurance Risk Dashboard February 2024 (Q3-2023 Solvency II Data)
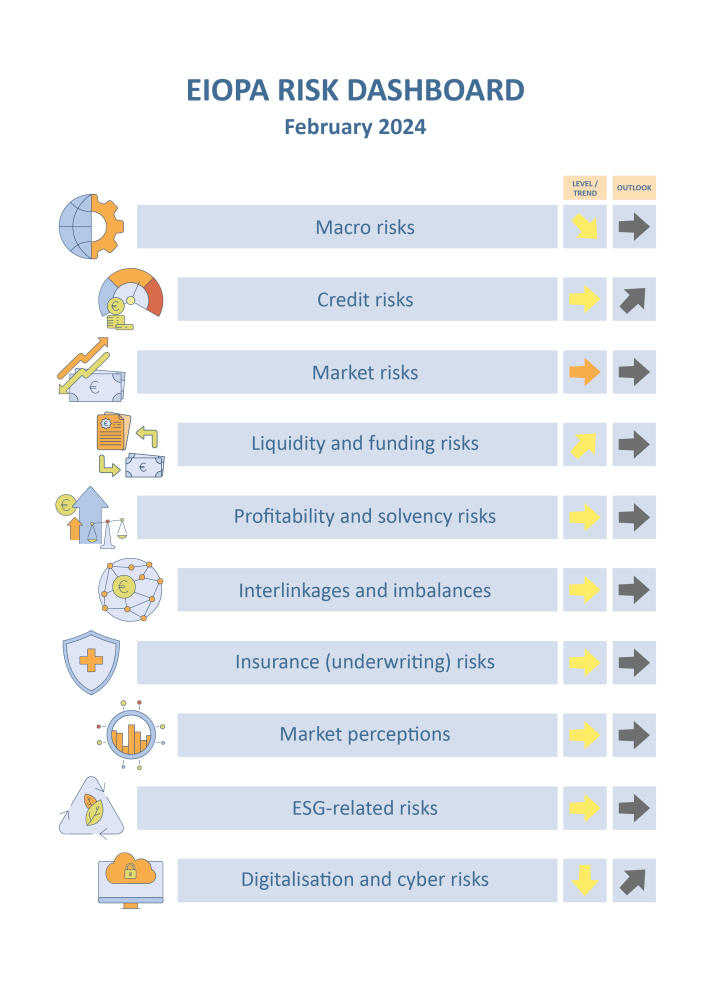
Key observations:
While macro-related risks persist in the insurance sector with projections still pointing to a subdued outlook for GDP growth, there is a declining trend, primarily propelled by a reduction in forecasted inflation across all geographical areas considered. Credit risks are stable at medium level, with spreads for the most relevant fixed income categories somewhat declining at end-2023. Market risks are prominent as bond volatility remains elevated and commercial real estate prices have further declined.
Liquidity and funding risks remain at medium level with an increasing trend driven by developments in cat bond issuance. The median of cash holdings has slightly decreased compared to the previous quarter. Profitability and solvency risks remain stable with a slight decline in the median ratio of assets over liabilities and in the median solvency ratio of insurance groups. The median SCR ratio of non-life undertakings reported an increase, while the distribution for life undertakings is overall unchanged.
Interlinkages and imbalances risks are also stable at medium level. Median exposures to banks, domestic sovereign debt, and derivative holdings, as well as the reinsured part of premiums, have slightly decreased compared to the previous quarters. Insurance risks remain at medium level with positive median year-on-year premium growth reported for both life and non-life business, and a further deterioration observed for the loss ratio.
Market perceptions show underperformance of life and non-life insurance stocks when compared to the broader market for the fourth quarter of 2023.
ESG related risks remain stable at medium level. The median exposure towards climate relevant assets hovers around 3.3% of total assets, while investments in green bonds are at around 7% of total green bonds outstanding.
Digitalization and cyber risks decreased to medium level, but they are expected to further increase according to the assessment of national insurance supervisors. Cyber negative sentiment also indicates an increasing concern in the fourth quarter of 2023. The annual rate of change in the frequency of cyber incidents impacting all sectors of activity, as measured by the latest publicly available data, remained high in the third quarter of 2023 but decreasing compared to the previous quarter.
Insurance Risk Dashboard November 2023 (Q2-2023 Solvency II Data)

Key observations:
Risks for the European insurance sector are elevated in the areas of macro, market and cyber, while they remain moderate for the other risk categories. Macro-related risks remain among the most relevant for the insurance sector as the outlook for the next four quarters GDP growth at global level has deteriorated and credit-to-GDP gap widened. CPI forecasts slightly further decreased. Credit risks are at medium level with no noticeable changes while market risks are prominent as volatility in equity market increased and bond volatility remain elevated.
Liquidity and funding risks remain stable, with the median of liquid assets ratio slightly improved compared to the previous quarter. On the other hand, bond issuance and catastrophe bond issuance increased. Profitability and solvency risks moderate slightly on the profitability side as performance indicators increased in the first half of 2023. The distribution of the SCR ratio improved especially for life and groups.
Interlinkages and imbalances risks also are constant. Exposures to banks, insurances and other financial institutions are overall stable, with minor changes in the distributions compared to the previous quarter. Derivatives to total assets and investments in domestic sovereign debt were stable in Q2-2023. Insurance risks remain at medium level with a positive median year-on-year premium growth for life business, after the negative levels reported in the previous quarters.
Market perceptions show underperformance of non-life insurance stocks when compared to the market for the second quarter of 2023.
ESG related risks remain stable at medium level, as insurers’ median ESG rating score remains unchanged around A-. The median exposure towards climate relevant assets hovers around 3.3% of total assets, while insurers’ investments in green bonds over total green bonds outstanding are at 7%. As for physical risks, the exposure at flood risks slightly increased while exposure at windstorm risk slightly decreased between 2021 and 2022.
Digitalization and cyber risks increased to high levels andare expected to further increase according to the supervisory assessment. The frequency of cyber incidents impacting all sectors of activity, as measured by publicly available data, increased since the same quarter of last year. Cyber negative sentiment also indicates an increasing concern in the third quarter of 2023.
Disclaimer: The November 2023 Risk Dashboard was updated on November 24, 2023 to address data quality issues in two graphs under the ESG risk section concerning insurers' investments in green bonds. These revisions do not impact the risk level or trend of the ESG-related risk category.
Insurance Risk Dashboard July 2023 (Q1-2023 Solvency II Data)
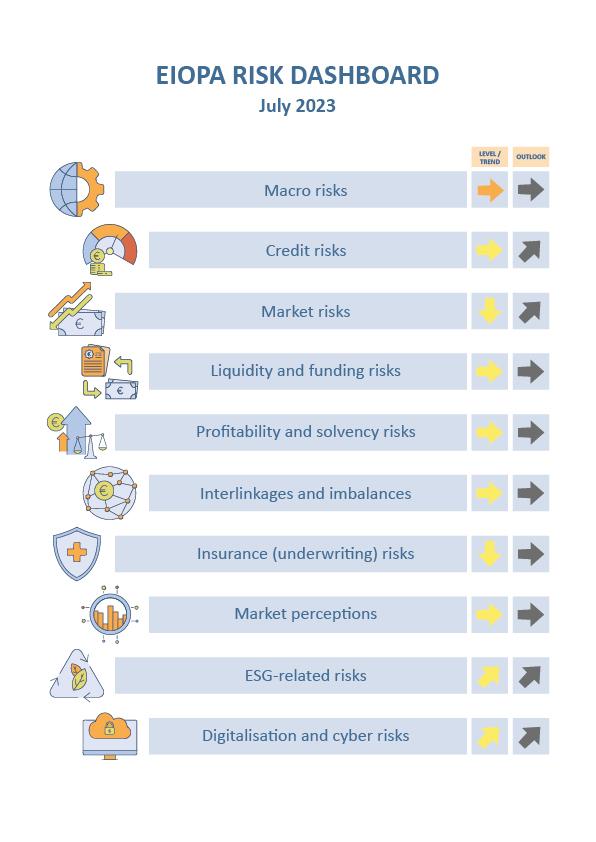
Key observations:
Risk levels for the European insurance sector remain broadly constant, with all risk categories pointing to medium risks with the exception of macro risk. Macro-related risks remain among the most relevant for the insurance sector. Forecasted GDP growth at global level further increased to 0.74%. CPI forecasts slightly decreased to 3.22% for the next four quarters. Credit risks is at medium level. The CDS spreads increased for financial secured bonds in the second quarter of 2023, while CDS spreads for other fixed income market segments receded slightly. Market risks decreased from high to medium level as volatility in equity market decreased and duration mismatch narrowed compared to the previous assessment.
Liquidity and funding risks show an increase in cash holdings and a drop in the liquid assets ratio in the first quarter of 2023. Profitability and solvency risks show a drop in the investment return for life insurers in 2022 mainly due to the large increase of unrealized losses following the increase of interest rates. The distribution of the SCR ratio for insurance groups decreased. Similarly, life insurers reported a slight decline in the median SCR ratio. On the other hand, assets over liabilities increased due to the higher interest rates. Interlinkages and imbalances risks remain at medium level while insurance risks decreased in Q1-2023, with the median year-on-year premium growth for non-life insurance decreasing to end 2021 levels.
Market perceptions show positive returns for insurance stocks, albeit an underperformance of life insurance stocks when compared to the market for the second quarter of 2023.
ESG related risks display an increasing trend with the median exposure towards climate relevant assets slightly increased to 3.3% of total assets. Moreover, the catastrophe loss ratio also deteriorated. On the other hand, the share of insurers’ investments in green bonds over total green bonds outstanding is stable compared to the previous quarter.
Digitalization and cyber risks also display an increasing trend with the materiality of these risks for insurance as assessed by supervisors increasing in the first half of 2023. The frequency of cyber incidents impacting all sectors of activity, as measured by publicly available data, increased since the same quarter of last year. The indicator cyber negative sentiment indicates a decreasing concern in the second quarter of 2023.
Insurance Risk Dashboard May 2023 (Q4-2022 Solvency II Data)
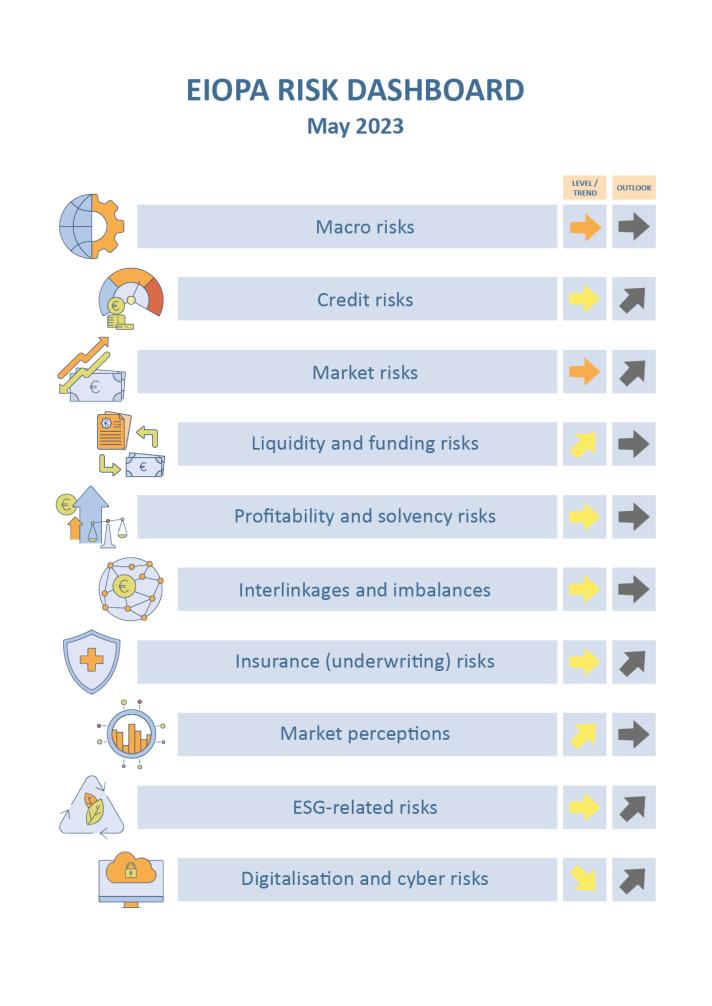
Key observations:
Risk levels for the European insurance sector remain broadly constant.
Macro-related risks remain among the most relevant for the insurance sector. Forecasted GDP growth at global level further increased to 0.53%. CPI forecasts hover around the high level of the latest assessment. Unemployment rates for the main geographical areas remained at low level. The weighted average of 10 years swap rates remains at higher level. Fiscal balances have deteriorated. The credit-to-gdp gap slightly increased. Central banks continue their contractionary monetary policy.
Credit risks remain at medium level. The CDS spreads increased for financial unsecured bonds in the first quarter of 2023, after the recent turmoil in the banking sector, while insurers’ median exposure this asset class had increased in Q4-2022. The median average credit quality of insurers’ investments remained stable, however it deteriorated for the top percentile of the distribution. The median share of below investment grade assets (with a credit quality step higher than 3) in insurers’ portfolios decreased.
Market risks remain at high level. Volatility in the bond market increased and equity market remained at higher level compared to the previous assessment. The median for the indicator on the concentration of assets decreased.
Liquidity and funding risks remain at medium level with an increasing trend. Cash holdings reported a drop in the last quarter of 2022. On the other hand, lapse rates increased.
Profitability and solvency risks remain at medium level. Life insurers reported an increase in their SCR ratio, while, the SCR ratio of non-life insurers experienced a slight decrease. Return on assets and return to premiums increased. The net combined ratio (for non-life insurers) deteriorated.
Interlinkage and imbalance risks remain at medium level. Although to a lower extent, insurers continued realizing market to market losses on those derivatives positions aimed at hedging interest rates declines. The exposure to banks and other financial institutions increased.
Insurance risks remain at medium level. The year-on-year premium growth for life insurance continued decreasing reaching the negative territory for the second consecutive quarter.
Market perceptions remain at medium level. Insurance life stocks overperformed, while non-life underperformed the market. The median price-to-earnings ratio of insurance groups increased. The median of CDS spreads of insurers slightly decreased. Insurers’ external ratings remained broadly stable since the last assessment.
ESG related risks remain at medium level. The median exposure toward climate relevant assets slightly increased to 3.2 % of total assets. The share of insurers’ investment in green bond over total green bonds outstanding slightly decreased compared to the previous quarter. The y-o-y growth of green bonds outstanding slightly decreased, while the median growth of insurers’ investment in green bonds increased.
Digitalisation and cyber risks are at medium level. The materiality of these risks for insurance as assessed by supervisors remains high. The frequency of cyber incidents impacting all sectors of activity, as measured by publically available data, decreased since the same quarter of last year. Cyber negative sentiment indicates an high amid stable concern in the first quarter of 2023.
Insurance Risk Dashboard January 2023 (Q3-2022 Solvency II Data)
Key observations:
Risk levels for the European insurance sector remain broadly constant.
Macro-related risks remain relevant for the insurance sector. Forecasted GDP growth at global level further decreased to -0.06%. The average CPI forecasts have been revised slightly downward, amid remaining at high level. Unemployment rate for the main geographical areas remained at low level. Weighted average of 10 years swap rates increased. Central banks continue the normalization of their monetary policy: the average global policy rates have increased to 2.7% and asset purchases continue at a slower pace than previous quarter and will further slowdown.
Credit risks remain at medium level. The CDS spreads increased for government and secured financial bonds, while slightly decreasing for unsecured financial and non-financial corporate bonds in the last quarter of 2022, driving the decreasing trend. Insurers’ relative exposure to non-financial corporate and financial secured bonds slightly decreased in Q3-2022, while exposure to sovereign and financial bonds remaining broadly stable. The median average credit quality of insurers’ investments remained stable.
Market risks remain at high level. Volatility in the bond market is very high and equity market remained at higher level than last year average. The median insurers’ exposure to bonds slightly decreased while median exposure to equity stays relatively unchanged while the median exposures to property slightly increased in Q3 2022.
Profitability and solvency risks remain at medium level. Life insurers reported a decrease in their SCR ratio for the second consecutive quarter, while the SCR ratio of non-life insurers experienced a slight increase.
Insurance risks remain at medium level with an increasing trend. The year-on-year premium growth for life insurance continued decreasing reaching the negative territory, while for non-life a significant increase was observed following the increasing trend experienced in the past quarters.
Interlinkage and imbalance risks remain at medium level. Due to the current increase of interest rate, insurers realized market to market losses on those derivative positions aiming at hedging interest rates declines.
Insurance risks remain at medium level with an increasing trend. The year-on-year premium growth for life insurance continued decreasing reaching the negative territory, while for non-life a significant increase was observed following the increasing trend experienced in the past quarters. The median exposure of the loss ratio increased.
Market perceptions remain at medium level. Insurance life and non-life stocks overperformed. The median price-to-earnings ratio of insurance groups remained around the same level. The median of CDS spreads of insurers decreased. Insurers’ external ratings remained broadly stable since the last assessment.
ESG related risks remain at medium level. Insurers mantained their relative exposure into green bonds, while the ratio of investments into green bonds over the total green bond outstanding slightly decreased. The median exposure to climate relevant assets remained around the same levels. Exposure at flood risk has been slightly decreasing in the high end of the distribution from 2020 to 2021. The cumulative catastrophe loss ratio slightly increased in Q3-2022.
Digitalisation and cyber risks are at medium level. The materiality of these risks for insurance as assessed by supervisors remains unchanged with cyber security and hybrid geopolitical conflict as main concerns. The frequency of cyber incidents impacting all sectors of activity, as measured by publically available data, increased since the same quarter of last year. Cyber negative sentiment indicates an high amid decreasing concern in the last quarter of 2022.
Insurance Risk Dashboard October 2022 (Q2-2022 Solvency II Data)

Key observations:
The European Insurance and Occupational Pensions Authority (EIOPA) published today its Risk Dashboard based on Solvency II data from the second quarter of 2022. The results show that insurers’ exposures to macro and market risks are currently the main concern for the insurance sector. All other risk categories, such as profitability and solvency, climate as well as digitalisation and cyber risks stay at medium levels.
Macro risks remain a key source of concern amid a further decrease in global GDP growth expectations and high CPI forecasts for the main geographical areas, even as unemployment remains low. The weighted average of 10 year swap rates increased. Central banks continue the normalisation of their monetary policy.
Market risks are currently at a high level. Volatility in bond and equity markets continue to top last year’s average. Property prices remain at the same level. Insurers’ median exposure to bonds and equity remain relatively unchanged while median exposure to property slightly increased in Q2 2022. Credit risks remain relatively moderate. CDS spreads remain at low levels for government bonds and financial bonds while further increasing for non-financial corporate bonds in the third quarter of 2022. Insurers’ relative exposure to different bonds categories remained broadly stable while slightly decreasing for government bonds in Q2. The median average credit quality of insurers’ investments remained stable.
Profitability and solvency risks remain constant with returns for insurers decreased in the second quarter of 2022 across all three return indicators (return on excess of aseets over liabilities, return on assets and return on premiums). The increase of interest rates since the beginning of 2022 may be the main driver behind insurers’ high SCR ratios.
Due to the current increase of interest rates, insurers booked market to market losses on derivatives given that they are typically positioned to hedge against interest rates declines.
Regarding market perceptions, insurance life and non-life stocks underperformed. The median price-to-earnings ratio of insurance groups is largely unchanged. The median of CDS spreads of insurers further increased even as insurers’ external ratings remained broadly stable since the last assessment.
On climate risks, insurers maintained their relative exposure to green bonds while the ratio of investments in green bonds over the total green bond outstanding slightly decreased. The growth of green bonds in insurers’ portfolios has decreased, while the growth of green bonds outstanding is stable.
The materiality of digitalisation and cyber risks for insurance as assessed by supervisors decreased slightly. Nevertheless, cyber security issues and concerns of a hybrid geopolitical conflict remain. The cyber negative sentiment indicates an increased concern in the third quarter of 2022 while the frequency of cyber incidents decreased compared to the same quarter last year.
Insurance Risk Dashboard July 2022 (Q1-2022 Solvency II Data)

Key observations:
The European Insurance and Occupational Pensions Authority (EIOPA) published today its Risk Dashboard based on Solvency II data from the first quarter of 2022. The results show that insurers’ exposures to macro, market and digitalisation risks are currently the main concern for the insurance sector. The other risk categories, such as insurance as well as profitability and solvency risks stay at medium levels.
Macro-related risks remain a key source of concern. Forecasted GDP growth at global level further decreased until Q2 2023, while inflation forecasts for main geographical areas remain at higher level reached in the previous assessment. Central banks are adjusting their action, the global average policy rate increased and asset purchases continue amid at a slower pace and will further slowdown. 10-year swap rates increased across currencies.
Market risks are currently at high level. Volatility in bond market increased and in equity market remained at high levels. Property prices slightly further increased. The median insurers’ exposure to bonds has been slightly decreasing, exposure to equity remained relatively unchanged and exposure to property slightly increased in Q1 2022. Credit risks remain relatively moderate, but CDS spreads further increased for financial unsecured and non-financial corporate bonds and the median exposure to below investment grade assets (with a credit quality step higher than 3) slightly increased.
Profitability and solvency risks remain at medium level. Given the increasing trend of interest rates since the beginning of the year, solvency position for life undertakings raised, while solvency position for groups dropped. Insurance risks remain at medium level in Q1-2022. The median of return on investment for life undertakings decreased. The year-on-year premium growth for non-life reported a substantial increase, while for life a slight decrease was observed.
Market perceptions remain moderate. Non-life insurance stocks slightly outperformed the stock market, while life stocks returns were in line. The median price-to-earnings ratio decreased.
Climate risks remain at medium level. Insurers slightly increased the share of green bonds in their assets portfolio, while the ratio of investments into green bonds over the total green bond outstanding slightly decreased.
Digitalisation and cyber risks are at high level. The materiality of these risks for insurance as assessed by supervisors increased given the resurge of cyber security issues and concerns of a hybrid geopolitical conflict.
Insurance Risk Dashboard April 2022 (Q4-2021 Solvency II Data)

Key observations:
European insurance sector remains resilient, but macro and digitalisation and cyber risks at a high level.
Macro-related risks are currently the main concern for the insurance sector, remaining at high level in current assessment reflecting the Russian invasion to Ukraine. Forecasted GDP growth at global level decreased until Q4 2022 and inflation forecasts for main geographical areas show an upward trend, with an average above 5%. 10 year swap increased and unemployment rates decreased. Monetary policies remain broadly accommodative, asset purchases continue amid at a slower pace and will further slowdown.
Credit risks have not changed significantly and remain relatively moderate. The CDS spreads remain at low levels for government bonds and financial secured bonds, but increased for financial unsecured and non-financial corporate bonds in the first quarter of 2022. The median investment in bonds and loans has changed in the last quarter of 2021. The median average credit quality of insurers’ investments remained stable. The median of below investment grade assets (with a credit quality step higher than 3) in insurers’ portfolios slightly increased.
Market risks overall did not increase compared to the previous assessment, notwithstanding the significant impact of Russian invasion of Ukraine. Volatility in bond market and equity market increased in the first quarter of 2022 reflecting uncertainties related to the geopolitical situation. Property prices increased in the last quarter 2021. The median insurers’ exposure to bonds, equity and property remained hovering around previous levels.
Profitability and solvency risks remain at medium level. Solvency position for groups increased, while the SCR ratio for solos life and non-life undertakings slightly dropped. Return on excess of assets over liabilities and return on assets decreased, remaining above the 2020 levels.
Interlinkages and imbalances risks remain at medium level with insurance groups’ exposure to insurances reporting a drop. The median investments in other financial institutions raised.
Market perceptions remain at medium level. The life and non-life insurance sector underperformed the stock market and the median price-to-earnings ratio decreased.
Climate risks are at medium level, with transition risk and physical risk stable. The median growth of insurers’ investment in green bonds has slightly increased. The y-o-y growth of green bond outstanding has also been volatile and it increased in the last quarter. The catastrophe loss ratio slightly decreased compared to the previous quarter.
Digitalisation and cyber risks increased to high level. The materiality of these risks for insurance as assessed by supervisors increased given the resurge of cyber security issues and concerns of a hybrid geopolitical conflict. Cyber negative sentiment indicates an increased concern in the first quarter of 2022. The frequency of cyber incidents impacting all sectors of activity, as measured by publically available data, increased significantly since the same quarter of last year.
Insurance Risk Dashboard January 2022 (Q3-2021 Solvency II Data)

Key observations
The European Insurance and Occupational Pensions Authority (EIOPA) published its Risk Dashboard based on Solvency II data from the third quarter of 2021. The results show that insurers’ exposures to macro risks remain at a high level while all other risk categories, such as insurance as well as profitability and solvency risks stay at medium levels.
With regards to macro risks, inflation forecasts have been revised upwards and the 10-year swap rates have increased across main currencies. Unemployment rates are still elevated. Financial markets stay broadly stable. Monetary policies remain accommodative although asset purchases continue at a slower pace and are expected to decelerate further.
After six quarters of increasing trend, solvency position for groups decreased, but still remained above year end 2020 level. SCR ratio for solo life undertakings slightly improved. Profitability indicators reported a slight deterioration, with a rise in the net combined ratio for non-life business.
Interlinkages and imbalances risks remain at a medium level.
Insurance Risk Dashboard October 2021 (Q2-2021 Solvency II Data)

Note: The structural break as of Q1 2020 related to the Brexit withdrawal agreement and represented with a dashed line indicates a break in the number of undertakings of the time series and rebalance of the country weights. Additionally, adjusted time series for EU27 before Q1 2020 are also disclosed to reflect potential variations driven by the structural break in the sample.
Key observations
The European Insurance and Occupational Pensions Authority (EIOPA) published its Risk Dashboard based on Solvency II data from the second quarter of 2021. The results show that insurers’ exposures to macro risks remain at a high level while all other risk categories, such as insurance as well as profitability and solvency risks, stay at medium levels. With regards to macro risks, inflation forecasts have been revised upwards. Unemployment rates are still elevated but on a decreasing trend. Financial markets stay broadly stable, amid fiscal and monetary support.
Overall profitability indicators and solvency positions for insurance groups continued improving in the second quarter of 2021. Insurance risks continued at a medium level, with year-on-year premium growth for non-life and life undertakings increasing for the second consecutive quarter. Market perceptions remain at a medium level.
The environmental, social and goverance (ESG) related risks, included for the first time in the current Risk Dashboard, are at a medium level, with transition and physical risks slightly improving. The catastrophe loss ratio decreased compared to the previous quarter, albeit not yet reflecting the potential negative impact of the European floods events in summer 2021.
This Risk Dashboard based on Solvency II data summarises the main risks and vulnerabilities in the European Union insurance sector through a set of risk indicators of the second quarter of 2021 complemented with market data and other available information. Solvency II data is based on financial stability and prudential reporting collected from 99 insurance groups and 2741 solo insurance undertakings.
Note:
- Reference date for company data is Q2-2021 for quarterly indicators and 2020-YE for annual indicators. The cut-off date for most market indicators is mid-September 2021.
- Risk Levels are based on a 4-level scale from Low (green) to Very high (red). Risk trend reports the quarter on quarter variation of the risk based on a 5-level scale from Substantial Decrease to Large Increase.
The Outlook displayed for the next 12 months is based on the responses received from 29 national competent authorities (NCAs) and ranked accordingly to the expected change in the materiality of each risk (substantial decrease, decrease, unchanged, increase and substantial increase).
Insurance Risk Dashboard July 2021 (Q1-2021 Solvency II Data)
Note: The structural break as of Q1 2020 related to the Brexit withdrawal agreement and represented with a dashed line indicates a break in the number of undertakings of the time series and rebalance of the country weights. Additionally, adjusted time series for EU27 before Q1 2020 are also disclosed to reflect potential variations driven by the structural break in the sample.
Key observations
The results show that insurers’ exposures to macro risks remain at high level while all other risk categories remain at medium level.
- With regards to macro risk, Gross Domestic Product growth and inflation forecasts registered new upward revisions. The 10 years swap rates have slightly increased across currencies in the second quarter of 2021.
- Financial markets remain broadly stable, amid fiscal and monetary support. Solvency positions for the first quarter of 2021 for all types of undertakings showed an improvement.
- Life insurers’ profitability, measured by annual investments’ returns, registered a notable deterioration in 2020.
- Insurance risks remain at medium level, in spite of deterioration of some indicators.
- The cumulative catastrophe loss ratio and year-on-year premium growth for non-life continued deteriorating.
- On the other hand, the loss ratio decreased to one of the lowest values and year-on-year premium growth for life reported a slight recovery after the deterioration in the previous quarters.
- Market perceptions remain at medium level with an increasing trend.
- The life insurance sector underperformed while non-life outperformed the stock market in the second quarter 2021.
This Risk Dashboard based on Solvency II data summarises the main risks and vulnerabilities in the European Union insurance sector through a set of risk indicators of the first quarter of 2021 complemented with market data and other available information. Solvency II data is based on financial stability and prudential reporting collected from 91 insurance groups and 2227 solo insurance undertakings.
Note:
- Reference date for company data is Q1-2021 for quarterly indicators and 2020-YE for annual indicators. The cut-off date for most market indicators is end June 2021.
- Risk Levels are based on a 4-level scale from Low (green) to Very high (red). Risk trend reports the quarter on quarter variation of the risk based on a 5-level scale from Substantial Decrease to Large Increase.
The Outlook displayed for the next 12 months is based on the responses received from the national competent authorities (NCAs) and ranked accordingly to the expected change in the materiality of each risk (Substantial decrease, decrease, unchanged, increase and substantial increase).
Insurance Risk Dashboard April 2021 (Q4-2020 Solvency II Data)

Note: The structural break as of Q1 2020 related to the Brexit withdrawal agreement and represented with a dashed line indicates a break in the number of undertakings of the time series and rebalance of the country weights. Additionally, adjusted time series for EU27 before Q1 2020 are also disclosed to reflect potential variations driven by the structural break in the sample.
Key observations
The results show that insurers’ exposures to macro risks remain at high level while all other risk categories remain at medium level. The European supervisors expect an increase in credit risks over the next 12 months, reflecting concerns over corporate indebtedness. With regards to macro risk, Gross Domestic Product growth and inflation forecasts registered new upward revision.
The long-term yields have increased across currencies in the first quarter of 2021. Financial markets remain broadly stable, amid an increase in bond volatility and concern over commercial real estate investments. Solvency positions for life business showed an improvement, while non-life business slightly deteriorated. Insurers’ profitability, measured by the return on assets and the return on excess of assets over liabilities improved due to positive market performance.
Despite this improvement the insurers’ profitability remained lower compared to pre-COVID levels. Insurance risks remain at medium level in spite of the deterioration of some indicators. The catastrophe loss ratio significantly increased and year-on-year premium growth for non-life continued deteriorating. On the other hand, year-on-year premium growth for life reported a slight recovery after the deterioration in the previous quarters. Market perceptions remain at medium level with an increasing trend. The insurance sector, both life and non-life, underperformed the stock market in the first quarter 2021.
This Risk Dashboard based on Solvency II data summarises the main risks and vulnerabilities in the European Union insurance sector through a set of risk indicators of the third quarter of 2020 complemented with market data and other available information. Solvency II data is based on financial stability and prudential reporting collected from 81 insurance groups and 2463 solo insurance undertakings.
Note:
- Reference date for company data is Q4-2020 for quarterly indicators and 2019-YE for annual indicators. The cut-off date for most market indicators is beggining of April 2021.
- Risk Levels are based on a 4-level scale from Low (green) to Very high (red). Risk trend reports the quarter on quarter variation of the risk based on a 5-level scale from Substantial Decrease to Large Increase.
The Outlook displayed for the next 12 months is based on the responses received from the national competent authorities (NCAs) and ranked accordingly to the expected change in the materiality of each risk (Substantial decrease, decrease, unchanged, increase and substantial increase).
Insurance Risk Dashboard January 2021 (Q3-2021 Solvency II Data)
Note: The structural break as of Q1 2020 related to the Brexit withdrawal agreement and represented with a dashed line indicates a break in the number of undertakings of the time series and rebalance of the country weights. Additionally, adjusted time series for EU27 before Q1 2020 are also disclosed to reflect potential variations driven by the structural break in the sample.
Key observations
Macro risks decreased from very high level to high level given the recovery observed in some countries after the first impact of the COVID-19 outbreak as well as positive expectations related to the vaccine. GDP growth forecast and credit-to-GDP gap rebounded in December. Market risks remain at medium level with a decreasing trend. Financial markets positively reacted to the COVID-19 vaccine news in the second half of 2020. Volatility continues decreasing in December, being close to pre-Covid-19 levels.
Going forward, an increasing trend for market risks is expected over the next 12 months due to the high uncertainty surrounding and the concerns related to decoupling between financial market performance and economic outlook. Liquidity and funding risks remain at medium level, amid decrease in cash holding. Profitability and solvency risks remain constant at medium level.
Solvency Capital Requirements (SCR) ratio for insurance groups undertakings slightly improved from the second quarter to the third quarter of 2020 amid remaining at lower levels than in the last quarter of 2019.
Insurance risks remain at medium level, amid decrease in premium growth. More specifically, year-on-year premium growth for both life and non-life reported a slight deterioration for the third consecutive quarter.
Market perceptions slightly deteriorated from September to the end of 2020 amid remaining at medium level. The median price-to-earnings ratio of insurance groups in the sample increased.
This Risk Dashboard based on Solvency II data summarises the main risks and vulnerabilities in the European Union insurance sector through a set of risk indicators of the third quarter of 2020 complemented with market data and other available information. Solvency II data is based on financial stability and prudential reporting collected from 90 insurance groups and 2269 solo insurance undertakings.
Note:
- Reference date for company data is Q3-2020 for quarterly indicators and 2019-YE for annual indicators. The cut-off date for most market indicators is beggining of January 2021.
- Risk Levels are based on a 4-level scale from Low (green) to Very high (red). Risk trend reports the quarter on quarter variation of the risk based on a 5-level scale from Substantial Decrease to Large Increase.
The Outlook displayed for the next 12 months is based on the responses received from the national competent authorities (NCAs) and ranked accordingly to the expected change in the materiality of each risk (Substantial decrease, decrease, unchanged, increase and substantial increase).
Insurance Risk Dashboard October 2020 (Q2-2020 Solvency II Data)
Note: The structural break as of Q1 2020 related to the Brexit withdrawal agreement and represented with a dashed line indicates a break in the number of undertakings of the time series and rebalance of the country weights. Additionally, adjusted time series for EU27 before Q1 2020 are also disclosed to reflect potential variations driven by the structural break in the sample. No expert judgement has been applied in any risk category. Credit and profitability and solvency risks show a large decrease trend due to the application of expert judgement in the July 2020 Risk Dashboard.
Key observations:
Macro risks remain at very high level given the persistent global impact of the outbreak of COVID-19 on economic activities, intensified by the second wave already initiated in several EU countries. Economic outlooks at the end of September, show the strongest expected decline in the last quarter of 2020 and first recovery in the second quarter 2021. The effects of the new wave of the pandemic might skew further downward GDP growth.
Moreover, the indicator on the 10 year swap rates decreased reaching new lows. Credit risks decreased to medium level. The CDS spreads continue decreasing across all market segments in September, remaining above the levels before COVID-19 crisis. Market risks decreased to medium level. Financial markets have stabilized in the first half of 2020, while remaining concerns related to decoupling between financial market performance and economic outlook that could lead to potential market correction remain. The volatility in the equity and bond markets continue decreasing, reaching lower levels than before COVID-19 crisis for the bond markets. Profitability and solvency risks decreased to medium level. SCR ratio for groups slightly improved from the last quarter amid remaining at lower levels than the last quarter of 2019.
All half-year profitability indicators, which now include the first month of the COVID-19 crisis and their impact on financial returns, show the expected signs of deteriorations. Insurance risks remain at medium level, driven by general concerns over decrease in premium growth, and in some jurisdictions over reserve adequacy. More specifically, year-on-year premium growth for life reported a significant deterioration for the second consecutive quarter, indicating already a negative impact from the COVID-19 outbreak. While market perceptions exhibit a decreasing trend, they are still at medium level. The median price-to-earnings ratio of insurance groups in the sample slightly increased dispersing from the low levels reached in the first half of 2020.
This Risk Dashboard based on Solvency II data summarises the main risks and vulnerabilities in the European Union insurance sector through a set of risk indicators of the second quarter of 2020 complemented with market data and other available information. Solvency II data is based on financial stability and prudential reporting collected from 98 insurance groups and 2507 solo insurance undertakings.
Note:
- Reference date for company data is Q2-2020 for quarterly indicators and 2019-YE for annual indicators. The cut-off date for most market indicators is end of September 2020.
- Risk Levels are based on a 4-level scale from Low (green) to Very high (red). Risk trend reports the quarter on quarter variation of the risk based on a 5-level scale from Substantial Decrease to Large Increase.
Insurance Risk Dashboard July 2020 (Q1-2020 Solvency II Data)
Note: Despite the fact that some indicators used in this Risk Dashboard do not still completely capture the latest development in the context of Covid-19 outbreak, the expected deterioration of the relevant indicators reflecting all available information in a forward looking perspective has been considered in the assigned risk levels where possible, and incorporated in the text. Expert judgment is applied in credit and profitability and solvency risks categories. The other risk categories levels reflect our quantitative methodology and the arrows show changes compared to the last assessment. The structural break as of Q1 2020 related to the Brexit withdrawal agreement and represented with a dashed line indicates a break in the number of undertakings of the time series and rebalance of the country weights. Additionally, adjusted time series for EU27 are also disclosed to reflect potential variations driven by the structural break in the sample.
Key observations:
Macro risk remain at very high level given the global impact of the outbreak of COVID on economic activities. The stabilization of financial markets and their rebound of financial markets after March 2020 raise the question whether the performance has decoupled from underlying macro-economic fundamentals, as GDP growth and inflation forecasts have been revised significantly downwards. Moreover, the indicator on the 10 year swap rates decreased reaching new lows, while unemployment rate increased. Credit risk remains at high level, as the risk of credit events remain elevated going forward. Profitability and solvency risks remain at high level. The expected deterioration, subsequent to the Covid-19 impact, is already reflected in some indicators. Asset over liabilities and SCR ratios for groups and non-life solo registered a weakening. A further deterioration for next quarter is still foreseen for SCR ratios, both life and non-life mainly driven by the low yield environment and the possible depreciation of assets in the context of Covid-19. The net combined ratio reported an improvement. Insurance risks decreased to medium level. Year-on-year premium growth for life reported a significant deterioration indicating already a negative impact from the Covid-19 outbreak. On the other hand, year-on-year premium growth for non-life and loss ratio registered a slight improvement. Catastrophe loss ratio continue increasing following the significant events occurred during 2019 and 2020– Australian bushfire season. Market perceptions remained stable at medium level. Stocks of life and non-life insurance continued to underperform relative to the market, which in contrast experienced an unexpected increase. Insurers’ CDS spreads returned to lower level. Insurers’ external outlooks show a net increase in negative revision as of June 2020.
This Risk Dashboard based on Solvency II data summarises the main risks and vulnerabilities in the European Union insurance sector through a set of risk indicators of the first quarter of 2020 complemented with market data and other available information. Solvency II data is based on financial stability and prudential reporting collected from 81 insurance groups and 2488 solo insurance undertakings.
Note:
- Reference date for company data is Q1-2020 for quarterly indicators and 2019-YE for annual indicators. The cut-off date for most market indicators is end of June 2020.
- Risk Levels are based on a 4-level scale from Low (green) to Very high (red). Risk trend reports the quarter on quarter variation of the risk based on a 5-level scale from Substantial Decrease to Large Increase.
Insurance Risk Dashboard - April 2020

Note: Despite the fact that some indicators used in this Risk Dashboard do not capture the latest market development in the context of Covid-19 outbreak, the expected deterioration of the relevant indicators reflecting all available information in a forward looking perspective has been considered in the assigned risk levels. This addresses the current situation of high uncertainty in the insurance market.
Key observations:
- Risk exposures for the European insurance sector increased as the outbreak of Covid-19 strongly affected the lives of all European citizens with disruptions in all financial sectors and economic activities. Market developments point to a “double-hit” scenario negatively affecting insurers on both asset and liability side as tested in previous stress test exercises.
- Macro and market risks indicators deteriorated in March 2020, moving from high to very high level. Overall, GDP forecasts have been revised significantly downwards across countries for 2020. For the first quarter of 2020, EU estimates point to the sharpest decrease of GDP and employment in the last two decades. Inflation forecasts are pointing to downward revisions for the next four quarters. Monetary policy support has been activated by all major central banks. Financial markets have been characterized by sell-off across asset classes, increased volatilities for bond and equity markets, increasing risk premia and flight to quality investment behavior.
- Credit risk has increased across all asset classes, in particular CDS of government bonds, financial and non-financial corporate bonds have increased sharply.
- Liquidity and funding risks raised to high level, as some indicators are expected to worsen via the latest market developments and the strong hit on economic activities, which is reducing incomes and could result in decreasing premiums and lowering new business. Moreover, the potential increase in claims and illiquid level of certain assets could put additional strains on the disposable liquidity of insurers in the medium to long-term horizon.
- Profitability and solvency risks increased to high level. A deterioration of indicators is estimated as a consequence of the recent negative market developments in the context of Covid-19 outbreak. Furthermore, a decrease in excess of assets over liabilities is expected, driven by drops in asset values and increase in liabilities. On the other hand, an improvement of the SCR ratios for groups and life undertakings across the whole distribution was observed in Q4-2019.
- Interlinkages and imbalances risks remain stable with an observed fall in the upper quartile of the derivative holdings distribution, potentially due to a market value reduction.
- Insurance risks raised to high level. The negative market developments may have negative effects via income reduction (due to the impact of drop in economic activity on new as well as existing business) and potential increase in claims for specific business lines.
- Market perceptions of the insurance sector has deteriorated as well. The EU insurance sector underperformed the market, both life and non-life businesses lines, and the median price-to-earnings ratio of insurance groups in the sample decreased since the last assessment. Insurers’ CDS spreads increased, while insurers’ external ratings and rating outlooks do not show sign of deterioration as of end March 2020.
This Risk Dashboard based on Solvency II data summarises the main risks and vulnerabilities in the European Union insurance sector through a set of risk indicators of the fourth quarter of 2019 complemented with market data and other available information. Solvency II data is based on financial stability and prudential reporting collected from 96 insurance groups and 2837 solo insurance undertakings.
Note:
- Reference date for company data is Q4-2019 for quarterly indicators and 2018-YE for annual indicators. The cut-off date for most market indicators is end of March 2020.
- Risk Levels are based on a 4-level scale from Low (green) to Very high (red). Risk trend reports the quarter on quarter variation of the risk based on a 5-level scale from Substantial Decrease to Large Increase.
Insurance Risk Dashboard – January 2020
Key observations
- Risk exposures for the European insurance sector are overall stable.
- Macro risks continue at a high level. Despite the recent easing of monetary policy by major central banks, the macroeconomic environment remains subdued and the prolonged low interest rates challenge the insurance sector.
- Market risks are also at a high level but show a decreasing trend due to lower expected bond market volatility since October. CDS spreads declined slightly across most bond segments, except sovereign bonds, with credit risks remaining at medium level.
- Solvency ratios for groups and life undertakings declined across the whole distribution in Q3-2019, but profitability and solvency risks continue at medium level.
- Interlinkages and imbalances show an increasing trend due to higher Solvency II values reported mainly for the largest derivative exposure – interest rate swaps. This could possibly be related to ALM strategies in response to low interest rates.
- Market perceptions remain at medium level, with life insurance stock prices outperforming the overall market and non-life stocks underpeforming.
Insurance Risk Dashboard – April 2019
Key observations
The results of the April 2019 Risk Dashboard show that the risk exposure of the European Union insurance sector remains overall stable.
Macro risks continue at medium level. Low swap rates and recent downward revisions to Gross Domestic Product (GDP) growth and inflation forecasts remain a concern going forward. Credit and market risks remain at medium level amid slightly decreased bond spreads, stable portfolio exposures and broadly unchanged bond volatility. Profitability and solvency risks are stable, with overall unchanged profitability indicators compared to the second half of 2018 and end-2017. Median Solvency Capital Requirement (SCR) ratios are well above 100% for groups, life and non-life solo undertakings. Insurance risks increased to medium level due to a further increase in the catastrophe loss ratio. Market perceptions remain stable at medium level with insurance stocks slightly outperforming the overall market, a reduction in insurance groups' Credit Default Swap (CDS) spreads and unchanged external ratings.
This risk dashboard based on Solvency II data summarises the main risks and vulnerabilities in the European Union insurance sector through a set of risk indicators of the fourth quarter of 2018. This data is based on financial stability and prudential reporting collected from 96 insurance groups and 2,873 solo insurance undertakings.
Note
- Reference date for company data is Q4-2018 for quarterly indicators and 2017-YE for annual indicators. The cut-off date for most market indicators is mid-March 2019.
- Risk Levels are based on a 4-level scale from Low (green) to Very high (red). Risk trend reports the quarter on quarter variation of the risk based on a 5-level scale from Substantial Decrease to Large Increase.
Insurance Risk Dashboard – January 2019
Key observations
The results of the third quarter 2018 show that the risk exposure of the European Union insurance sector remains broadly stable. Given the ongoing reduction in the accommodative stance of monetary policy, macro risks stand at medium level. However, further downward revisions of economic growth forecasts remain a concern going forward. Credit and market risks continue at medium level, with Credit Default Swaps (CDS) spreads for corporate bonds as well as equity market volatility increasing since September. Interlinkages and imbalances risks increased due to an increase in intrasectoral exposures, that can be explained by corporate actions and Mergers and Acquisitions (M&A) activities by some insurance groups. Insurance risks also increased following the impact on (re)insurers loss ratios of the natural catastrophes observed in 2018Q3, but remain at low level. Underpricing and underreserving driven by competition could be a concern for some lines of business. Market perceptions are stable at medium level, with insurance stocks outperforming the market in spite of a general deterioration in equity market performance. Insurers' price-to-earnings ratios went slightly down, while CDS spreads slightly increased.
This risk dashboardbased on Solvency II data summarises the main risks and vulnerabilities in the European Union insurance sector through a set of risk indicators of the third quarter of 2018. This data is based on financial stability and prudential reporting collected from 96 insurance groups and 2,906 solo insurance undertakings.
Note
- Reference date for company data is Q3-2018 for quarterly indicators and 2017-YE for annual indicators. The cut-off date for most market indicators is beginning of January 2019.
- Risk Levels are based on a 4-level scale from Low (green) to Very high (red). Risk trend reports the quarter on quarter variation of the risk based on a 5-level scale from Substantial Decrease to Large Increase.
Insurance Risk Dashboard – October 2018
Key observations
The results of the second quarter 2018 show that the risk exposure of the European Union insurance sector remains stable overall. Macro risks continue at medium level amid continued economic recovery and less expansionary monetary policy. A potential future deterioration in the assessment due to political and international trade tensions cannot be excluded. Bond market volatility declined since June and overall Credit Default Swap (CDS) spreads remained broadly stable at low levels despite adverse developments in sovereign bond markets in some countries. Liquidity and funding risks increased due to a higher average coupon-to-maturity ratio of a limited number of bond issuances. Profitability has been overall stable and Solvency Capital Requirement (SCR) ratios are above 100% for most insurers.Market perceptions were mixed with insurance stocks outperforming the market, but at the same time concerns increased as regards the market mispricing of risks.
This Risk Dashboard based on Solvency II data summarises the main risks and vulnerabilities in the European Union insurance sector through a set of risk indicators of the second quarter of 2018. This data is based on financial stability and prudential reporting collected from 98 insurance groups and 2,904 solo insurance undertakings.
Note
- Reference date for company data is Q2-2018 for quarterly indicators and 2017-YE for annual indicators. The cut-off date for most market indicators is mid-September 2018. Any market movements and potential losses from natural catastrophes occurred after the indicated cut-off dates are not yet reflected in the risk assessment.
- Risk Levels are based on a 4-level scale from Low (green) to Very high (red). Risk trend reports the quarter on quarter variation of the risk based on a 5-level scale from Substantial Decrease to Large Increase.
Insurance Risk Dashboard – July 2018
Key observations
The results of the first quarter 2018 show that the risk exposure of the insurance sector in the European Union remains stable overall with a decline in macro and insurance risks and an increasing trend in market risks. Persisting low yields and recent adverse developments such as increased protectionism should not be neglected, despite the improvement in recent economic data and the ongoing normalisation of monetary policy. Higher volatility in bond markets since March led to an increase in market risks, but these continue at a medium level. Credit risks also remain at a medium level, although spreads increased across all bond segments. Profitability and insurance risks benefited from the fading out of the impact of last year's natural catastrophes on (re)insurers' technical results. Median solvency ratios remain at satisfactory levels, though the reliance of some life insurers on transitional measures is high. Market perceptions were marked by an overall positive change in insurance groups' external rating outlooks, which was counterbalanced by an underperformance of insurance stocks relative to the overall market.
Note
- Reference date for company data is Q1-2018 for quarterly indicators and 2017-YE for annual indicators. The cut-off date for most market indicators is mid-June 2018
- Risk Levels are based on a 4-level scale from Low (green) to Very high (red). Risk trend reports the quarter on quarter variation of the risk based on a 5-level scale from Substantial Decrease to Large Increase.
Insurance Risk Dashboard – April 2018
Key observations
The results of the fourth quarter of 2017 show that the risk exposure of the insurance sector in the European Union remained stable. Despite positive macroeconomic developments, low interest rates are still a major source of risk for European insurers. Credit and market risks remained at a medium level. Spreads further decreased and concerns about potential risk mispricing remained. Volatility of equity prices increased and valuations are now slightly lower. Median profitability levels were broadly the same as in the fourth quarter of 2016 and solvency positions continued to be strong for both groups and solo companies. The impact of the natural catastrophes from the third quarter kept insurance risks at a medium level. Market perceptions were mixed, with insurers' stock prices outperforming the market, but at the same time there was a deterioration of the external rating outlook for some insurance groups.
This Risk Dashboard based on Solvency II data summarises the main risks and vulnerabilities in the European Union insurance sector through a set of risk indicators of the fourth quarter of 2017. This data is based on financial stability and prudential reporting collected from 95 insurance groups and 2,930 solo insurance undertakings.
Note
- Reference date is Q4-2017 for quarterly indicators and 2016 YE for annual indicators. The cut-off date for most indicators based on market data is end-March 2018.
- Risk Levels are based on a 4-level scale from Low (green) to Very high (red). Risk trend reports the quarter on quarter variation of the risk based on a 5-level scale from Substantial Decrease to Large Increase.
Insurance Risk Dashboard – January 2018
Key observations
The results of the third quarter 2017 show that the risk exposure of the insurance sector in the European Union remained overall stable. Despite positive macro and market trends, the risks linked to the low interest rates and to potential credit risk mispricing continued to be major concerns for the European insurance industry. Improvements in the solvency ratios were mainly driven by the increase in the eligible own funds. Some profitability and underwriting indicators deteriorated due to the impact of the recent natural catastrophes. Market perception remained stable with some improvements in the rating outlooks.
This risk dashboard based on Solvency II data summarises the main risks and vulnerabilities in the European Union insurance sector through a set of risk indicators of the third quarter of 2017. This data is based on financial stability and prudential reporting collected from 97 insurance groups and 2,963 solo insurance undertakings.
Note
- Reference date for the quarterly data is Q3-2017 (data extracted on 05/01/2018), while the cut-off date for most other indicators is beginning of January 2018.
- Risk Levels are based on a 4-level scale from Low (green) to Very high (red). Risk trend reports the quarter on quarter variation of the risk based on a 5-level scale from Substantial Decrease to Large Increase.
Insurance Risk Dashboard – October 2017
Key observations
The results of the second quarter 2017 show that the risk exposure of the insurance sector in the European Union remains overall stable with some slight improvements in the solvency ratios of groups and life solo undertakings. Profitability of the sector has shown some positive signs both for life and non-life. Inflation rate forecast is decreasing inverting the positive trend observed till March 2017, whereas unemployment rates continue to decrease. Despite some positive developments, the continuing low-yield environment and the observation that market fundamentals might not properly reflect the underlying credit risk, are still important concerns for the European insurance industry. Recent natural catastrophe events have not yet been reflected in the data, therefore no impact on the industry is reflected at this stage. Market perception, driven by the outperformances of the insurance stocks and the reduction of the Credit Default Swap Spreads, improved. Ratings and rating outlooks remain stable.
This risk dashboard based on Solvency II data summarises the main risks and vulnerabilities in the European Union insurance sector through a set of risk indicators of the second quarter of 2017. This data is based on financial stability and prudential reporting collected from 93 insurance groups and 3,076 solo insurance undertakings.
Note
- Reference date for company data is Q2-2017 (data extracted on 26/09/2017), while the cut-off date for most other indicators is end-September 2017
- Risk Levels are based on a 4-level scale from Low (green) to Very high (red). Risk trend reports the quarter on quarter variation of the risk based on a 5-level scale from Substantial Decrease to Large Increase.
Insurance Risk Dashboard – July 2017
Key observations
The results show that the risk exposure of the insurance sector in the European Union remained overall stable in the first quarter 2017 with Solvency II ratios remaining strong and stable for groups whereas a slight deterioration has been observed particularly for solo non-life insurance undertakings. Volatility has decreased and global inflation rates are fluctuating near the 2% medium-term inflation target. Despite these positive signs, the continuing low-yield environment and the observation that market fundamentals might not properly reflect the underlying credit risk are still important concerns for the European insurance industry. Nevertheless, market perception is relatively stable with some signs of improvement in the Credit Default Swap spreads.
This risk dashboard based on Solvency II data summarises the main risks and vulnerabilities in the European Union insurance sector through a set of risk indicators of the first quarter of 2017. This data is based on financial stability and prudential reporting collected from 93 insurance groups and 3,076 solo insurance undertakings.
Note
- Reference date for company data is Q1-2017, while the cut-off date for most other indicators is end-June 2017.
- Risk Levels are based on a 4-level scale from Low (green) to Very high (red). Risk trend reports the quarter on quarter variation of the risk based on a 5-level scale from Substantial Decrease to Large Increase. For a thorough description of the methodology and of the presentation refer to the Background Note.
Insurance Risk Dashboard – May 2017
Key observations
The results show the risk exposure of the insurance sector remained overall stable and some positive market developments were identified. Solvency II ratios are stronger due to higher market values of assets and the increase of the risk free curve used for discounting the technical provisions. Volatility has decreased and inflation rates have slowly started to converge to desired target levels.
Despite these positive signs, the continuing low-yield environment and the observation that market fundamentals might not properly reflect the underlying credit risk, are still important concerns for the European Union insurance industry. This is also reflected in the slightly deteriorating market perception and the recent underperformance of insurance stock prices.
This risk dashboard based on Solvency II data summarises the main risks and vulnerabilities in the European Union insurance sector through a set of risk indicators of the fourth quarter of 2016. This data is based on financial stability and prudential reporting collected from 93 insurance groups and 3,076 solo insurance undertakings.
Note
- Reference date for company data is Q4-2016, while the cut-off date for market-based data is end-March 2017.
- Risk Levels are based on a 4-level scale from Low (green) to Very high (red). Risk trend reports the quarter on quarter variation of the risk based on a 5-level scale from Substantial Decrease to Large Increase. For a thorough description of the methodology and of the presentation refer to the Background Note.
| Resources | |
|---|---|
| Risk dashboard - May 2017 | Background note |
Insurance Risk Dashboard – February 2017
Note
- Reference date for company data is Q3-2016, while the cut-off date for market-based data is end-December 2016.
- Risk Levels are based on a 4-level scale from Low (green) to Very high (red). Risk trend reports the quarter on quarter variation of the risk based on a 5-level scale from Substantial Decrease to Large Increase. For a thorough description of the methodology and of the presentation refer to the Background Note.
Risk dashboard releases 2017 - 2021